CilView user manual
Requirements: .NET Framework 4.5+
License: BSD 3-Clause
Repository: https://gitflic.ru/project/smallsoft/ciltools
CilView is a windows application to display CIL code of methods in .NET assemblies. The key features are:
- Displaying CIL code of methods in the specified assembly file or process
- Automatically building C#/VB sources and displaying the resulting CIL
- Displaying contents of CIL assembler source files (*.il)
- Syntax highlighting
- Navigation to the referenced method's code by clicking on the method reference
- Exporting CIL code into file
- Displaying process information and stack traces of managed threads (when process is opened)
- Displaying source code from which the method's CIL was compiled
- Executing methods interactively and inspecting the results
View assembly file
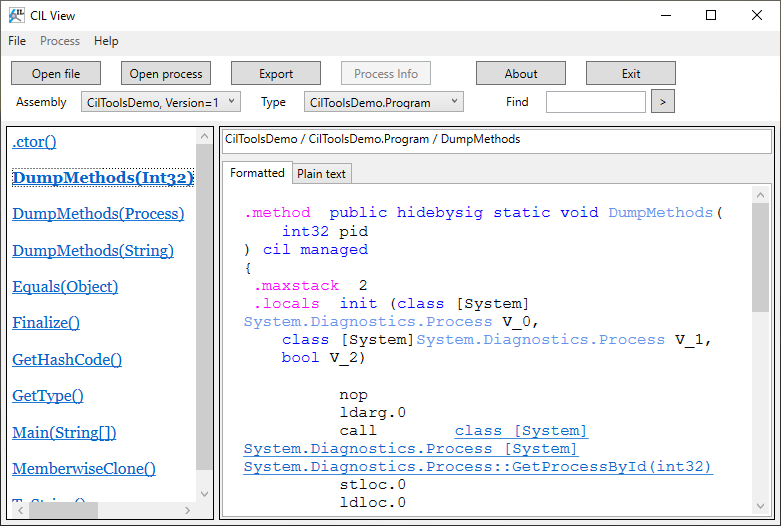
1. Click File -> Open menu or press the Open file button.
2. Select the managed assembly EXE or DLL file in the file open dialog.
3. Select type from the Type drop-down list in the main window
4. Select method in the left panel.
5. The right panel will display the CIL disassembly of the selected method.
All method references on the Formatted tab are hyperlinks to the referenced methods. Clicking one them will open the referenced method's code in the right panel, even if the method is from another assembly, as long as that assembly could be loaded.

To view detailed information about CIL instruction, double-click on the instruction opcode in formatted view. The displayed dialog box will provide information such as opcode and operand sizes and raw instruction bytes hexadecimal code.
View the resulting CIL for C#/VB sources
This feature enables you to view disassembled CIL code corresponding to the entered code snippet. CIL View will compile the provided code in background, and open the output binary if the compilation is successful. If the build fails, it will display the build output to you.
Click File -> Open code menu.
Paste the input source code into the text area.
Select the appropriate language from the combobox.
Click OK.
CIL View will open the output assembly. You can browse its contents as described above.
The "Open code" window only supports a self-contained code snippet without any dependencies or special build options. If you need more complex scenarios, open an MSBuild project file (.csproj/.vbproj) instead. To do this, click File -> Open menu and select the project file in the file open dialog.
CIL View can compile the provided sources in different ways, depending on your environment. First, it tries to use .NET SDK (dotnet build) if it's installed on your system. If the build fails or .NET SDK is not installed, it tries to build using the MSBuild version bundled with .NET Framework. For .NET SDK, the supported language versions depend on installed SDK version. For .NET Framework MSBuild, C# 5.0 or Visual Basic 11.0 (VS 2012) are supported.
NOTE: On 64-bit Windows CIL View can only use 64-bit .NET CLI (located at
C:\Program Files\dotnet\dotnet.exe).
View the contents of CIL assembler source file
Click File -> Open menu or press the Open file button.
Select CIL assembler source file (*.il) in the file open dialog.
To view CIL code of the particular type, select it in the Type drop-down list. You cannot navigate between methods in the opened CIL in this case, but the syntax highlighting works. Note that opening large files can crash or freeze the application.
View assemblies in the specified process
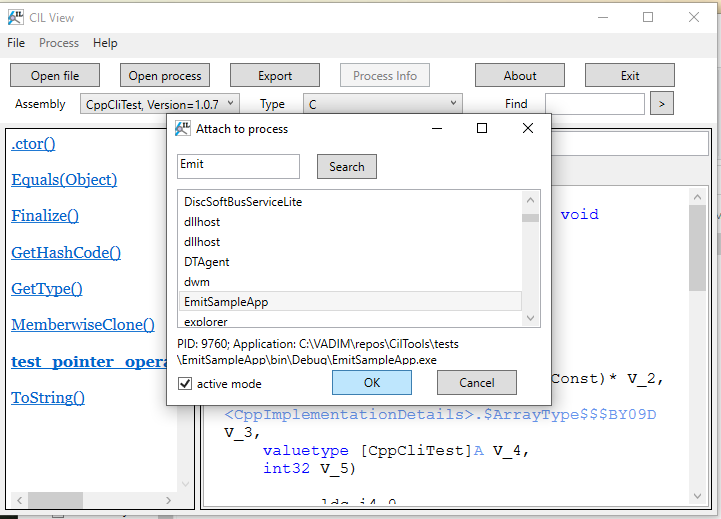
1. Click File -> Open process menu or press the Open process button.

2. Select the process from the list in the appearing Attach to process dialog.
You can search process by entering the process name starting fragment or ID into the text field and pressing Search.
3. Check the active mode checkbox if you want to get more accurate info.
NOTE: When attaching in active mode, the target process is suspended. Do not use active mode on the application that is currently performing critical business tasks.
4. Press OK. The CIL View will scan the target process for loaded assemblies and open them.
5. Select assembly from the Assembly drop-down list in the main window
6. Select type from the Type drop-down list in the main window
7. Select method in the left panel.
8. The right panel will display the CIL disassembly of the selected method.
You can also view the code of dynamic methods generated at runtime in the target process by selecting the <...DynamicMethods> entry in the assembly drop-down list (it is displayed at the end of the list). Starting from version 2.2, methods from dynamic assemblies are not included under dynamic methods and instead can be opened under the corresponding dynamic assembly.
Limitations when displaying code from the process
If the assembly is a dynamic assembly or an assembly that could not be loaded by CIL View as file (this is usually happens with some mixed-mode assemblies which have some PE structures stripped off, so they could be loaded by CLR, but not by System.Reflection.Metadata), the following limitations apply:
- Method return value or parameter types are not shown
- String literal tokens are not resolved
- Standalone signature tokens are not resolved
- Tokens of external assembly members are not resolved
- Local variables are not shown
- Exception handling blocks are not shown (except for methods from dynamic assemblies)
For dynamic methods, the following limitations apply:
- Method signatures are not shown
- All tokens, except for method tokens, are not resolved
- Local variables are not shown
When opening the 64-bit process, the following limitations apply:
- Dynamic assemblies and dynamic methods are not shown
- Assemblies that could not be loaded by CIL View as files (see above) are not shown
- Process and threads information is not available
NOTE: .NET Core shared host is 64-bit on 64-bit Windows, but if you want to overcome these limitations, you can build it targeting the win-x86 runtime ID and start it from the resulting EXE file rather than using shared host.
Examining managed threads
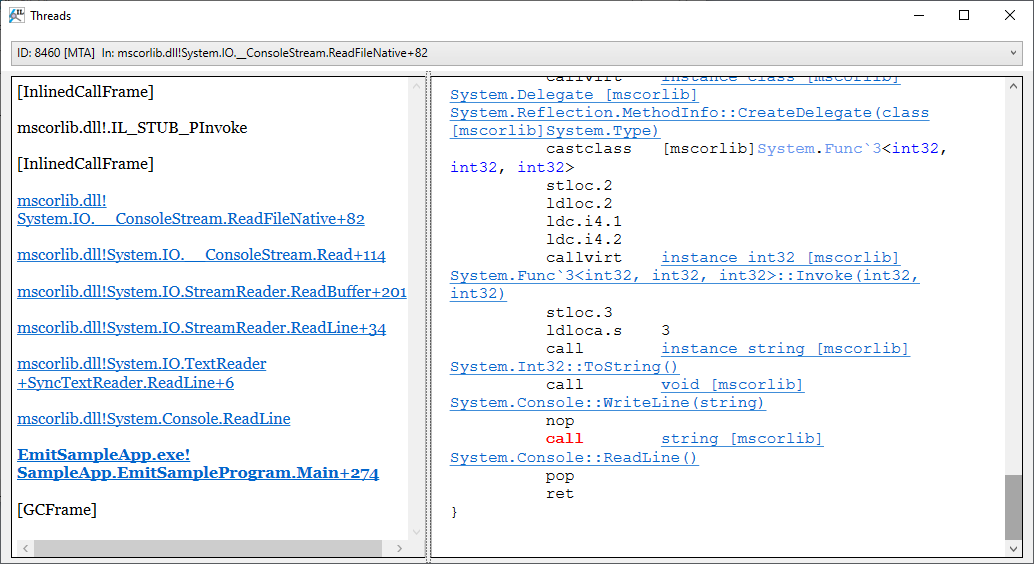
To examine managed threads when process is opened, click Process -> Threads menu. The Threads window displays a drop-down list of managed threads. Each list item contains native thread ID, thread type for special threads (GC, Finalizer, Thread pool), COM apartment type (STA or MTA), and the topmost stack frame info. Select thread from the list to view the full stack trace.
The stack trace will be displayed in the left panel. Some stack frames are hyperlinks, and clicking on them will open the corresponding method in the right panel. The instructions belonging to the approximate currently executed code fragment are highlighted in red. This feature only works reliably when attaching in active mode.

Using search
You can search assemblies, types and methods by entering the fragment of their names into the Find text field and pressing the ">" button. CIL View searches methods in the currently selected type, if the type is selected. In a similar way, types are searched in the currently selected assembly, if one is selected. The search results are shown in the context menu. Clicking on the menu item navigates to the corresponding object.
Disassembler options
There are a couple of options that control the output of disassembler displayed in CIL View. They are enabled or disabled using checkboxes in View menu:
View -> Include code size. Enables outputting the method's bytecode size, in bytes, as a code comment at the start of the method body.
View -> Include source code. Enables outputting of source code fragments from which particular instructions were compiled.
CIL View can output source code if symbol files for the disassembled assembly are available and point into valid local source file locations. Supported symbol formats are Windows PDB and Portable PDB. Source code is included as code comments preceding their corresponding instructions.
Exception analysis
To figure out exceptions that the method could potentially throw, open that method and use Tools -> Show exception (methods) menu command. In the opened window you'll see the list of exception types as well as the call stack that could trigger them. The CIL View recursively scans the analysed method and all methods called by it, and searches for exceptions that are thrown and not handled up the stack. Not that exception analysis might be inaccurate (bot false positives and false negatives, so it's only good for a quick estimate of thrown exceptions. To perform exception analysis on all methods of the current type, use Tools -> Show exception (type).
To compare exceptions actually thrown by methods of the type and exceptions mentioned in their documentation, select the type and use Tools -> Compare exceptions command. In the appearing dialog box, select the XML documentation file to compare. CIL View supports both regular ECMA XML emitted by C# compiler and monodoc XML format. The opened window will show the differences between exceptions reported by analysis and exceptions documented in ECMA XML <exception> tags.
The exception analysis is supported when opening both files and processes. However, when you hit any limitations mentioned above, the analysis accuracy decreases.
Source code viewer
This feature enables you to display source code corresponding to disassembled CIL code. Source code viewer can fetch source code using symbols line data (see Disassembler options section above for information about symbols support) or display the decompiled code (currently only supported for abstract methods or methods implemented in unmanaged code).
To view the source code for individual instructions, click Tools -> Show source code. In the View source window you'll see the CIL code of the sequence point on the left and its corresponding source code fragment on the right. Use < and > buttons to navigate between sequence points, or the file hyperlink to open the whole source file in your default editor.
To view the source code for the whole method, click Tools -> Show source code (method). The Source code window will display the method's source code as well as the information about where it was fetched from.
If the source code is located on external server (this feature is called Source Link), the source viewer will prompt you with a dialog box to allow navigating to server. If you choose Yes, the source code will be opened in your default browser. Any subsequent attempts for the same domain will open the browser automatically without prompting again. The Source Link is supported for Portable PDB only.
Method execution
WARNING: Executing a method from unknown origin could be dangerous. Don't use this feature unless you are sure a method does not contain a malicious code! There's no isolation or security control provided for the code being executed.
To execute the current method interactively, use the Tools -> Execute menu command. In the Execute method window, enter values for method parameters, if it has them, specify the timeout value that limits method execution time, and press Execute. The CIL View will load the method's assembly for execution and invoke the method using reflection, showing the results to you in a dialog box when it returns. The dialog box will show a method's return value, output parameter values (ref/out) or exception details, it the method would have thrown an exception. Note that if a method crashes or otherwise somehow corrupts the application state (the assembly is loaded into the main application domain), you might not see the mentioned output at all.
Method execution feature has some limitations. It currently only supports primitive types or types convertible from string as method parameters. Instance methods, generic methods and constructors are not supported. Also the assembly in which the method is housed must target .NET Framework or .NET Standard and have x86 or AnyCPU processor architecture.
File properties
To view infomation about currently opened assembly file, click File -> Properties. The file properties window will display general information about assembly file, Portable Executable header parameters, assembly-level custom attributes and referenced assemblies and unmanaged modules.
ClickOnce installation with auto-update
You can install CIL View via ClickOnce if you want to download updates automatically. The ClickOnce download URL: https://msdn-whiteknight.github.io/CilTools/update/
Using auto-update requires stable internet connection and access to the https://msdn-whiteknight.github.io/ website. If you are using old Windows or .NET Framework versions, you might be unable to connect due to TLS protocol version or ciphersuite mismatch.
Copyright (c) 2024, MSDN.WhiteKnight
See Help - Credits or credits.txt for copyright and license notices of third-party projects.